A map editor that opens in a tab
Open a tab, drag a rectangle over your forest, and the roads, streams and contours arrive in orienteering symbols. Then you draw, lay the sheet out, and send it to print. Here is the whole path.
 Andrey Surzhikov
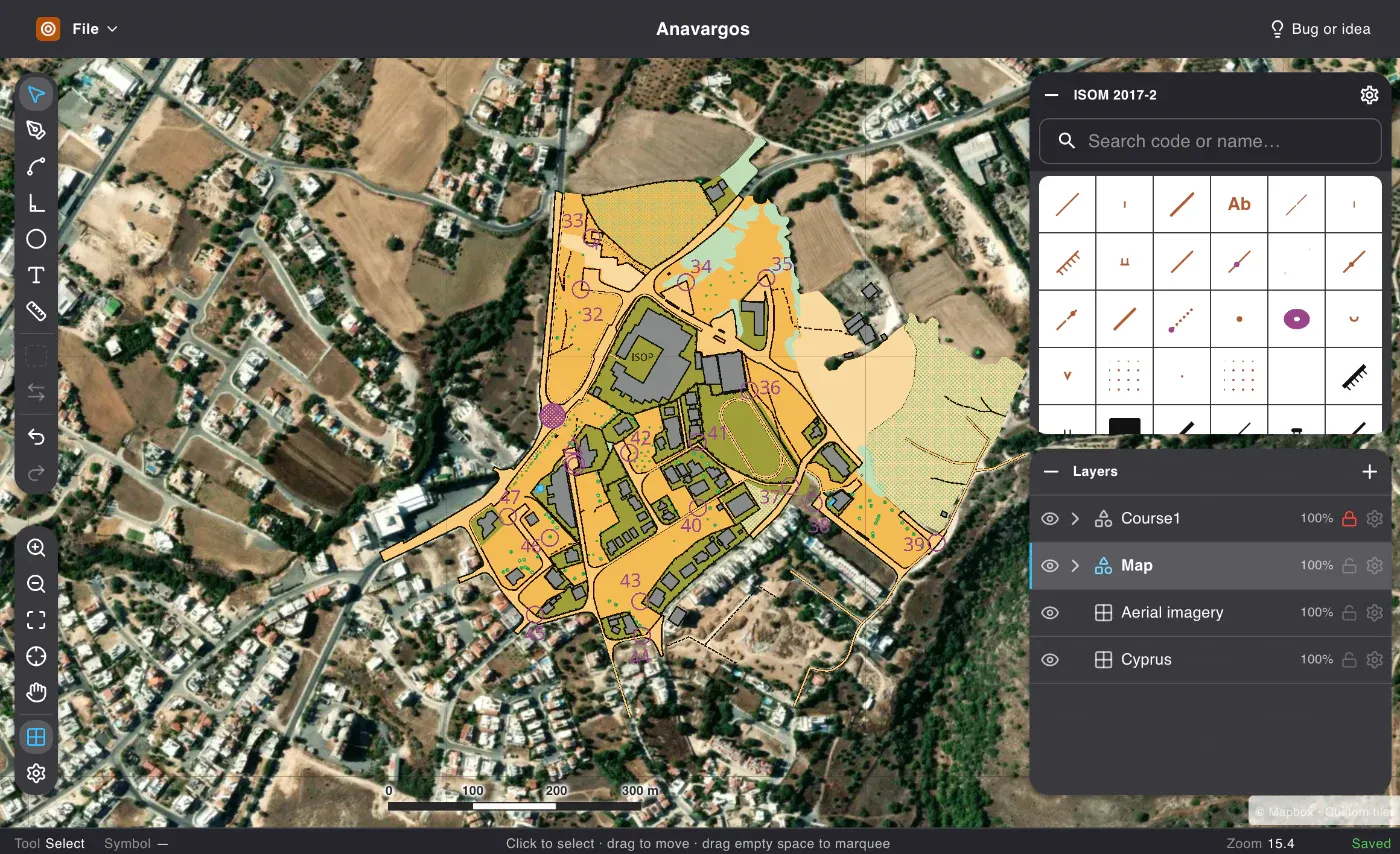
A map starts on a screen and ends on paper, and everything between those two points is the work. Gratic does that stretch in a browser tab: the base comes from the national survey, the symbols are the ones the standard defines, the sheet is measured in millimetres, and a second person can be drawing the same map while you are.
Nothing to install
The editor is at my.gratic.app; you sign in with your address and a code that arrives by mail. There is no download, no licence to move between machines, no version to keep in step with the rest of the club. It runs on Windows, on a Mac, and on the club laptop that nobody is allowed to install software on.
While this is being built it costs nothing.
The first move is not a blank sheet
Drag a rectangle over the area you are mapping, and the editor goes and asks the national survey what it already knows there. Finland answers with the land survey, the Netherlands with PDOK, France with IGN, Cyprus with its cadastre, and OpenStreetMap answers anywhere at all.
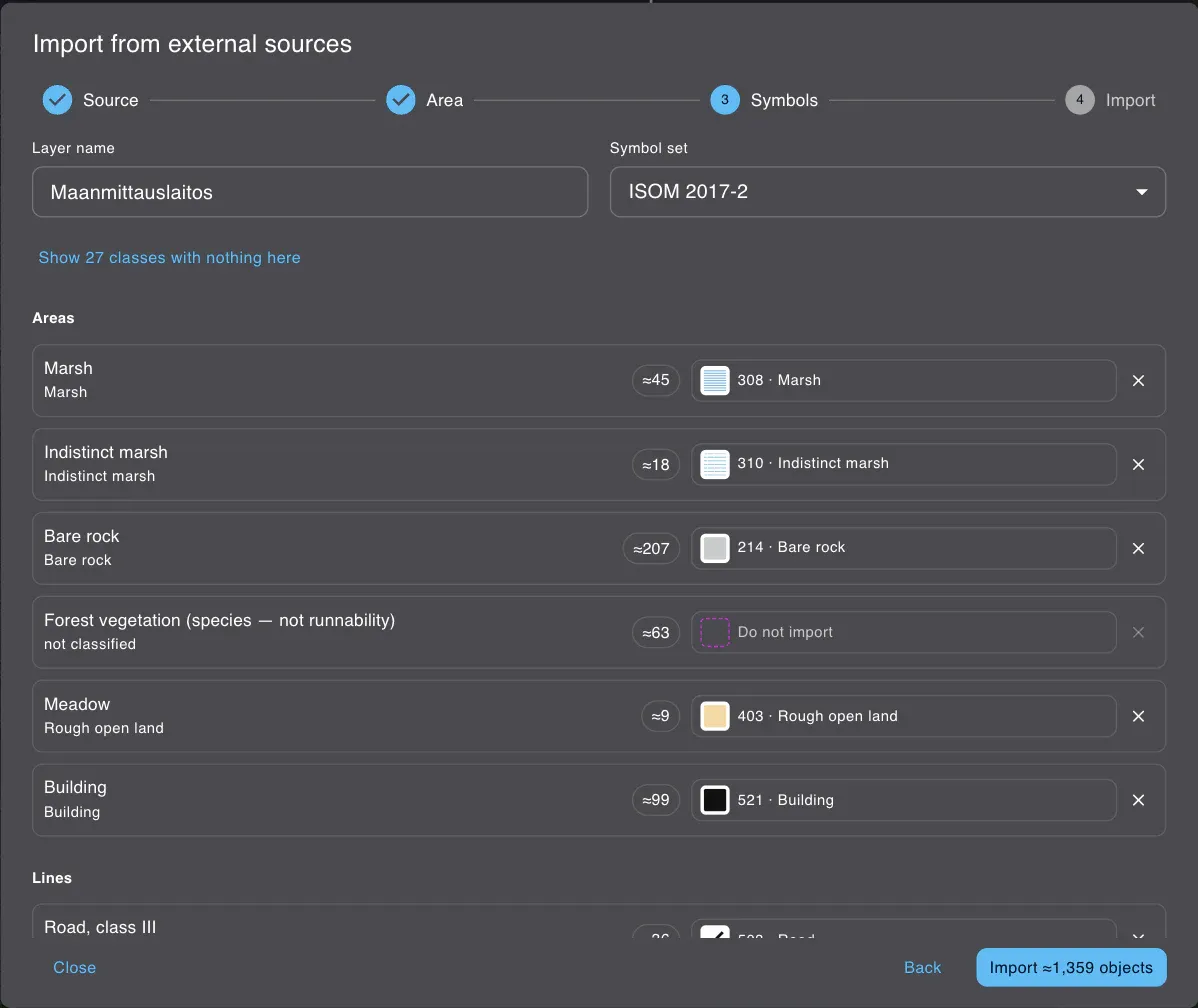
Drag a rectangle over your forest and the editor asks the national survey what it already knows there, and shows you how much is coming before anything lands
You choose what each class of objects becomes, and the wizard tells you how many objects of that class are actually inside your rectangle. Switch a class off and the number moves by exactly what that class holds, because the count came from the service rather than from a sample. The import arrives as its own layer, locked, underneath the one you draw on.
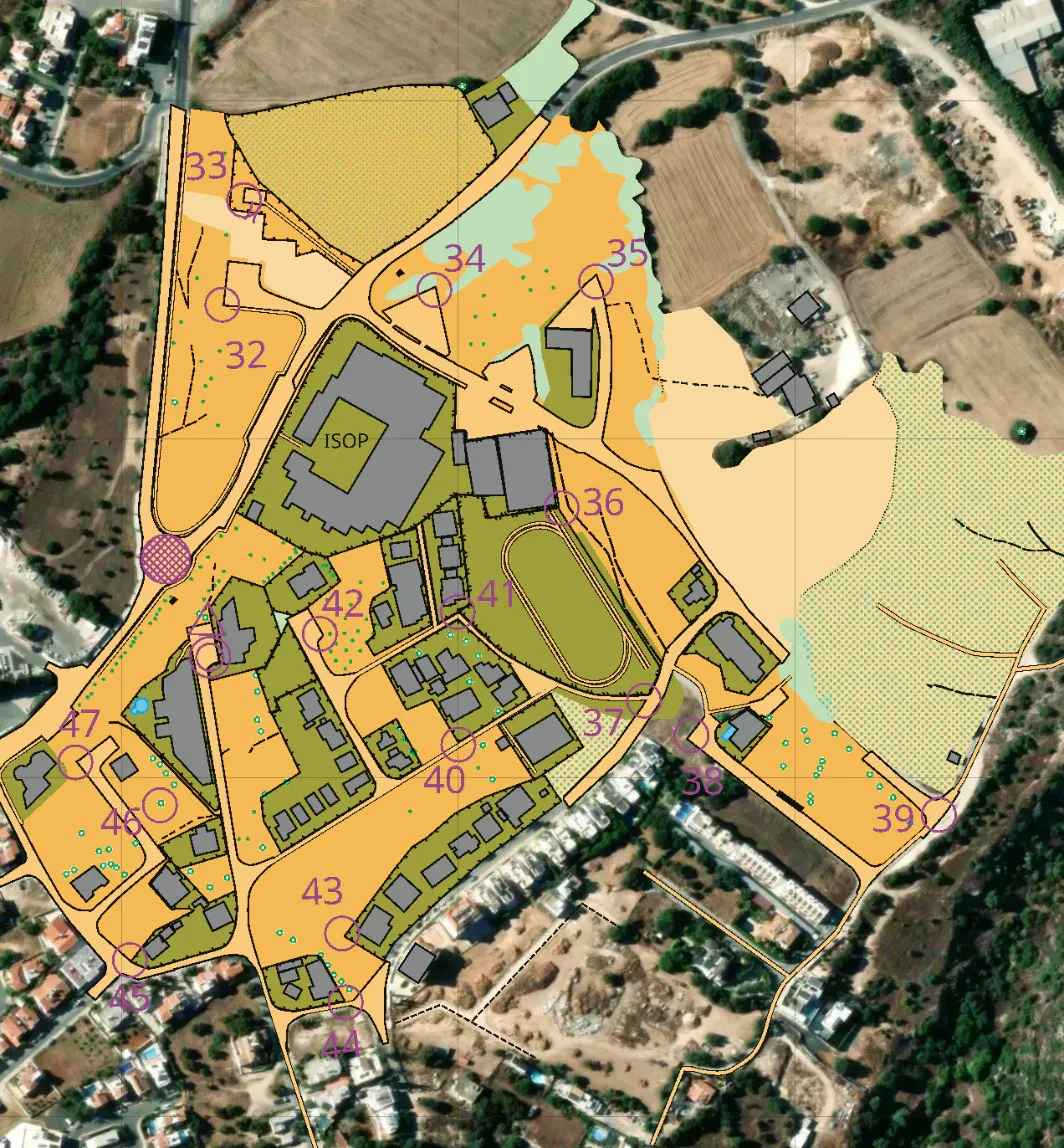
What the state knows is roads, streams, buildings and contours. What it does not know is how fast you can run through the forest, and no database will ever hold that. The import saves you the tracing. It does not save you the walk.
What you already have comes in, and goes back out
Maps drawn in OCAD and OpenOrienteering Mapper open here, with their symbols; the import shows which of them it recognised before anything lands on your map. Scans and GeoTIFF come in as raster layers, a scan placed by four points on the ground. GPS tracks from the field come in as tracks.
And it goes back out: the export writes files that open in OCAD and OpenOrienteering Mapper.
The symbols are the standard ones
The symbols and inks of ISOM are in the document from the moment you create it, and the sets for sprint, mountain bike and ski orienteering are there the same way. Nothing to download, nothing to point the program at.
The pen knows what it is drawing. Choose a contour and you are drawing a smooth curve; choose a building and you are drawing right angles. And every symbol is yours to change: widen the footpath and every footpath on the map is wider, because objects hold a symbol code rather than a copy.
Between layers the layer decides, inside a layer the ink
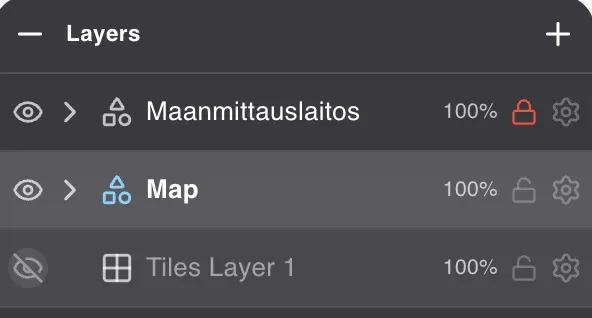
The base, the imagery, the scans and your own drawing are separate layers, each with its own visibility, opacity and lock. The imported data sits below you and cannot be nudged by accident, and the order of that list is what decides which layer hides which.
Inside a single layer, though, the drawing order decides nothing. There it is the order of the inks, exactly as a printing press lays them down: green over yellow is a different map from yellow over green. That is the rule an orienteering map is built on, and it is why the colour table here is a table rather than a palette.
Between layers the layer order decides what covers what, and inside a layer it is the ink
The sheet is the point
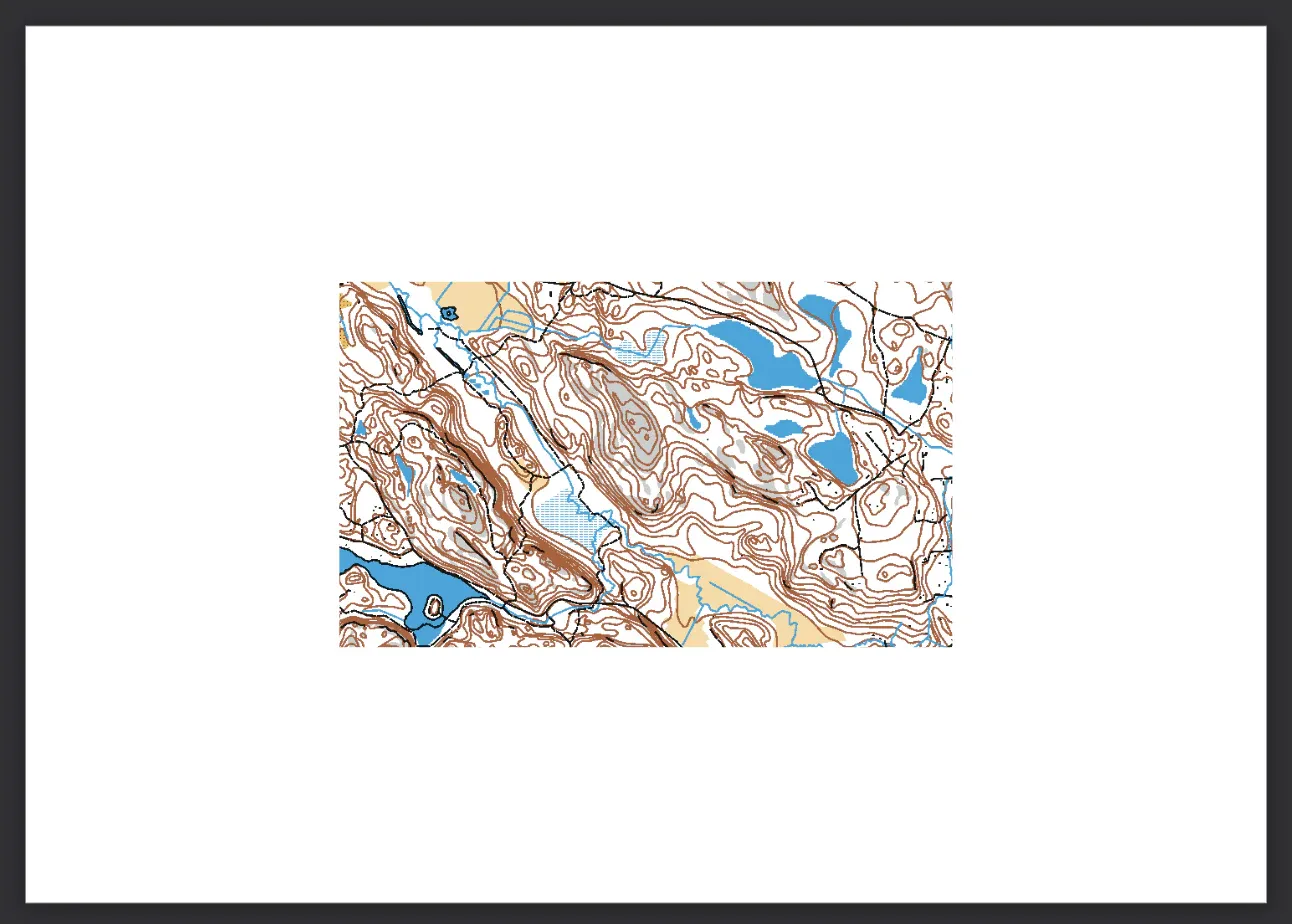
A map is finished when it is printed. The sheet is a real page with real millimetres, and you place map windows on it, each with its own centre and its own scale. An inset is a second window, not a second file, and it prints as an enlargement: make the terrain twice as large and the control circles, line widths and pattern spacing grow with it.
The screen and the PDF run the same drawing list, so the printed version cannot quietly drift away from what you were looking at.
Two people, one map
Two mappers can work on the same map at the same time, from different machines, without sending files back and forth. While you drag an object your neighbour sees it as busy and does not pull the same line the other way.
Two people draw the same map at once, and there is one copy of it
That last part is the one that changes how a club works. There is no master file on somebody’s laptop, no date in the filename, no person whose job it is to know which copy is current.
What we are doing next
The list of national sources grows a country at a time, and the order is decided by what unlocks the most rather than by which country is next in the alphabet: eight of them are waiting on one thing, support for arbitrary map projections.
If the agency in your country publishes topographic data and you know the endpoint that actually answers, that is the most useful thing you can send us. A working address from somebody who already queries it saves the better part of a day.